
.png)

Team BioTech
Phase 1 Information:
Problems & Research
This page includes additional information relevant to Phase 1 of the Project, "Problem and Research." These Charts, Graphs, and Images include detailed captions. Captions include links to sources. All Charts, Graphs, and Images were designed by Emma A. Simmons and/or Sarah C. Simmons. Still Photographs and Videos were created by Lisa S. McLeod-Simmons (Copyright Notice, Image/Multimedia Use Release Notice)
Click on Images to Enlarge
Barriers to
Healthcare
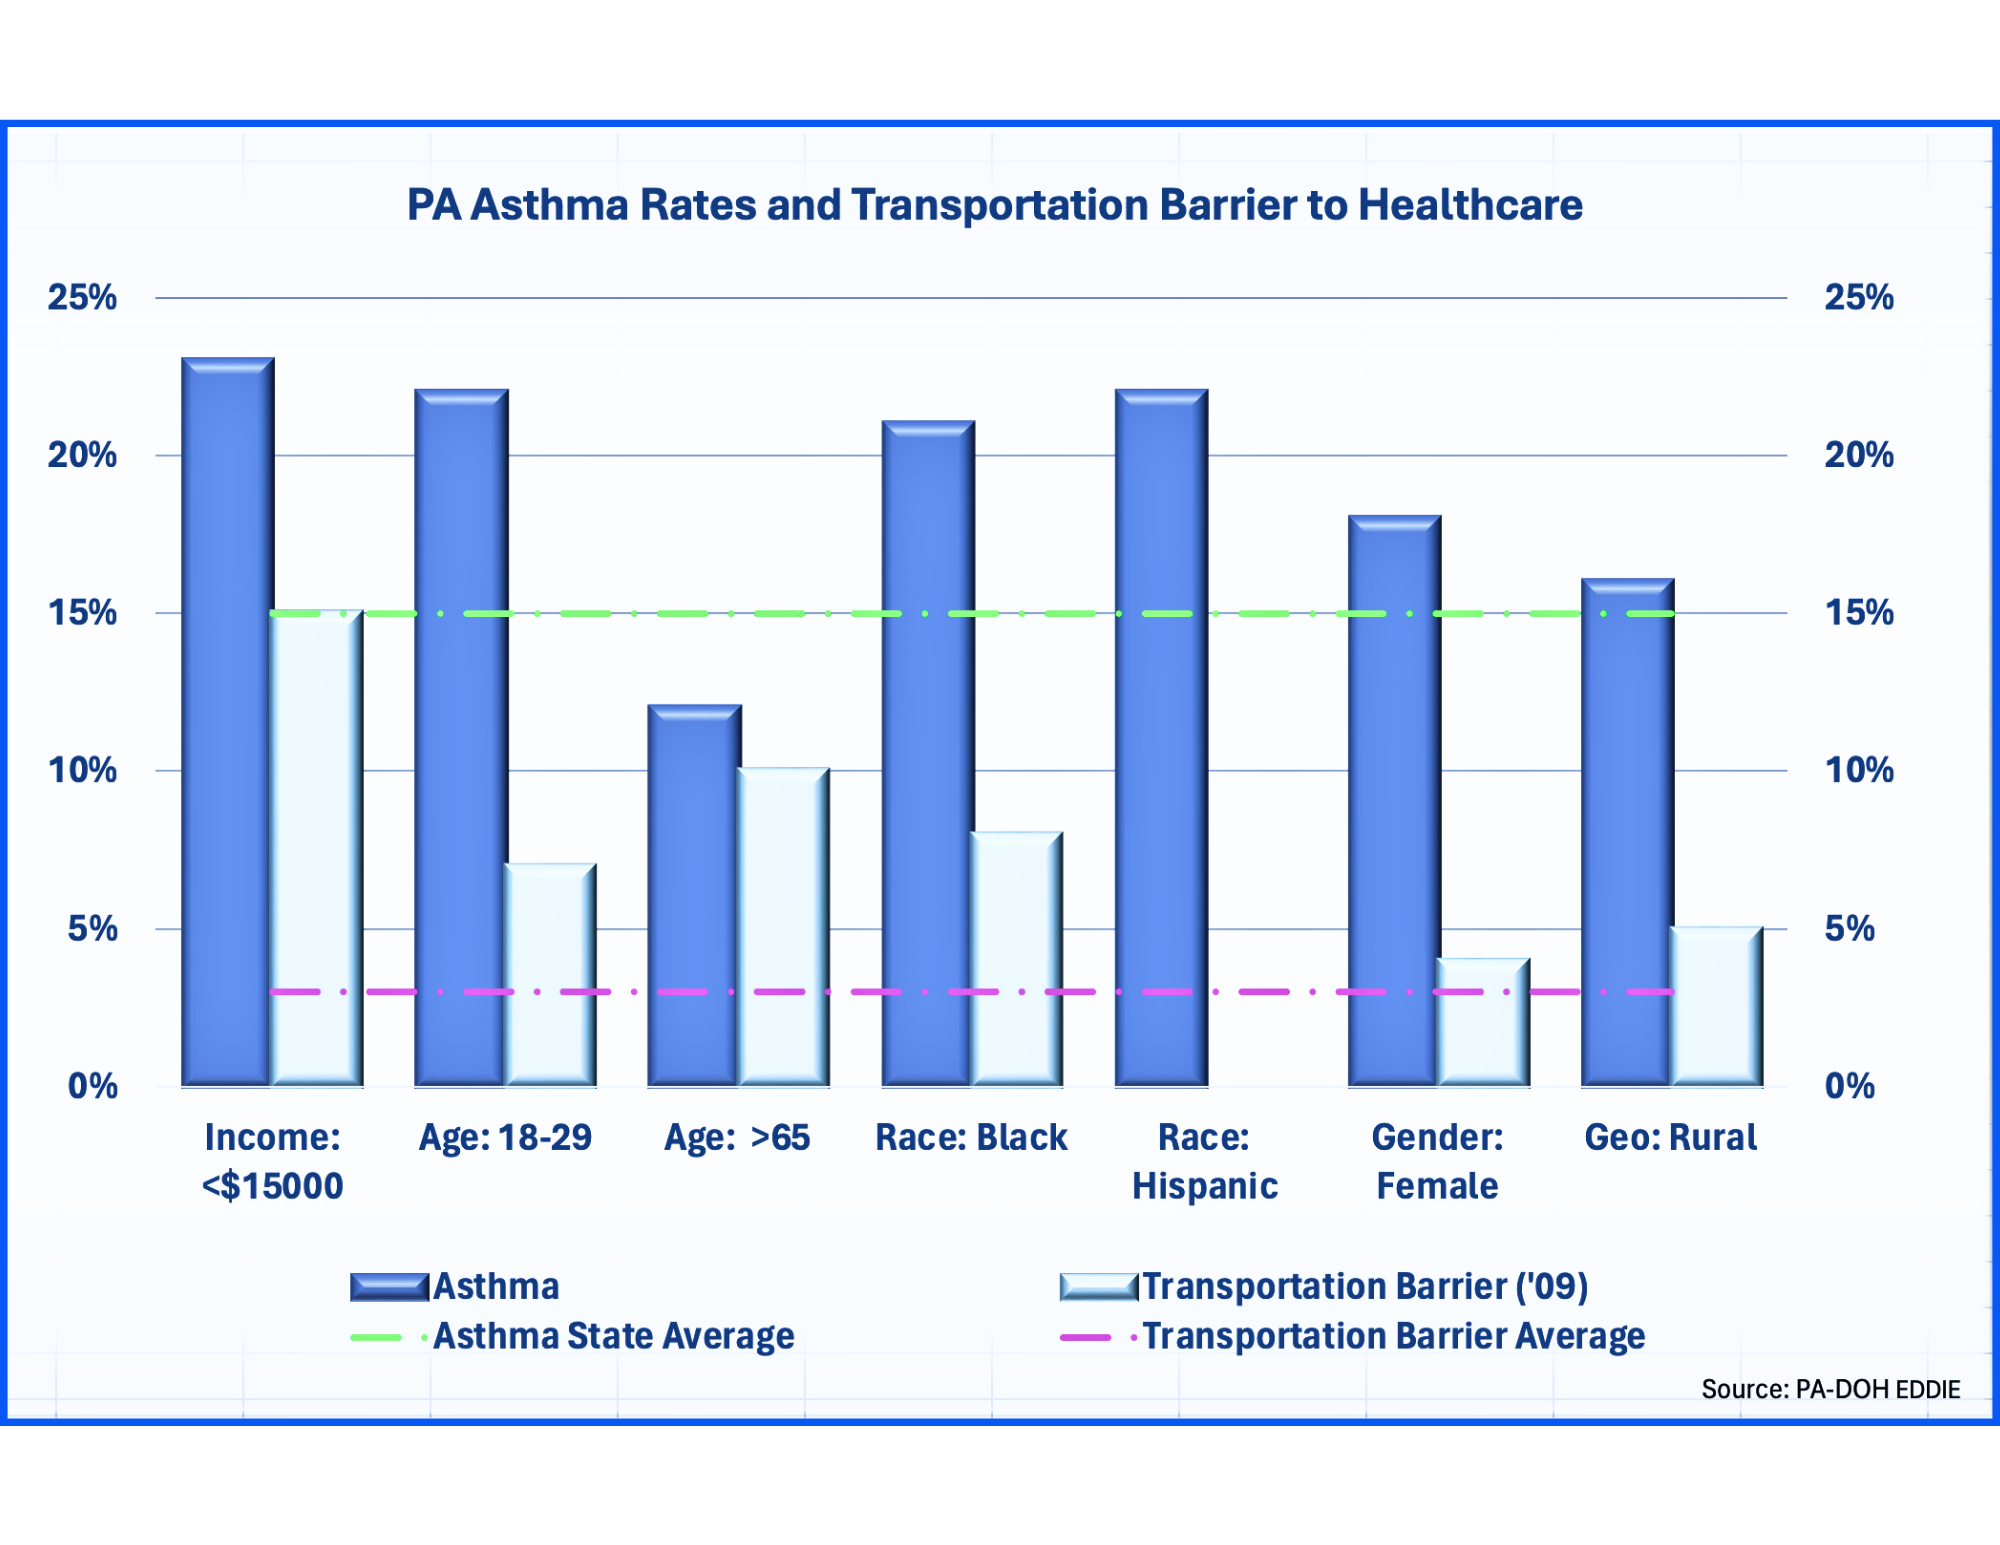
PA Asthma Rates by Demographic and Transportation Barriers to Healthcare. This chart illustrates the connections between chronic diseases, demographic variables, and access to healthcare.
01
In Pennsylvania, the youngest and oldest citizens, those with low incomes, racial minorities, and women are more likely to have asthma and are more likely to experience transportation barriers to accessing healthcare. (Source: PA-DOH EDDIE, 2022)
02

PA Healthcare
Challenges
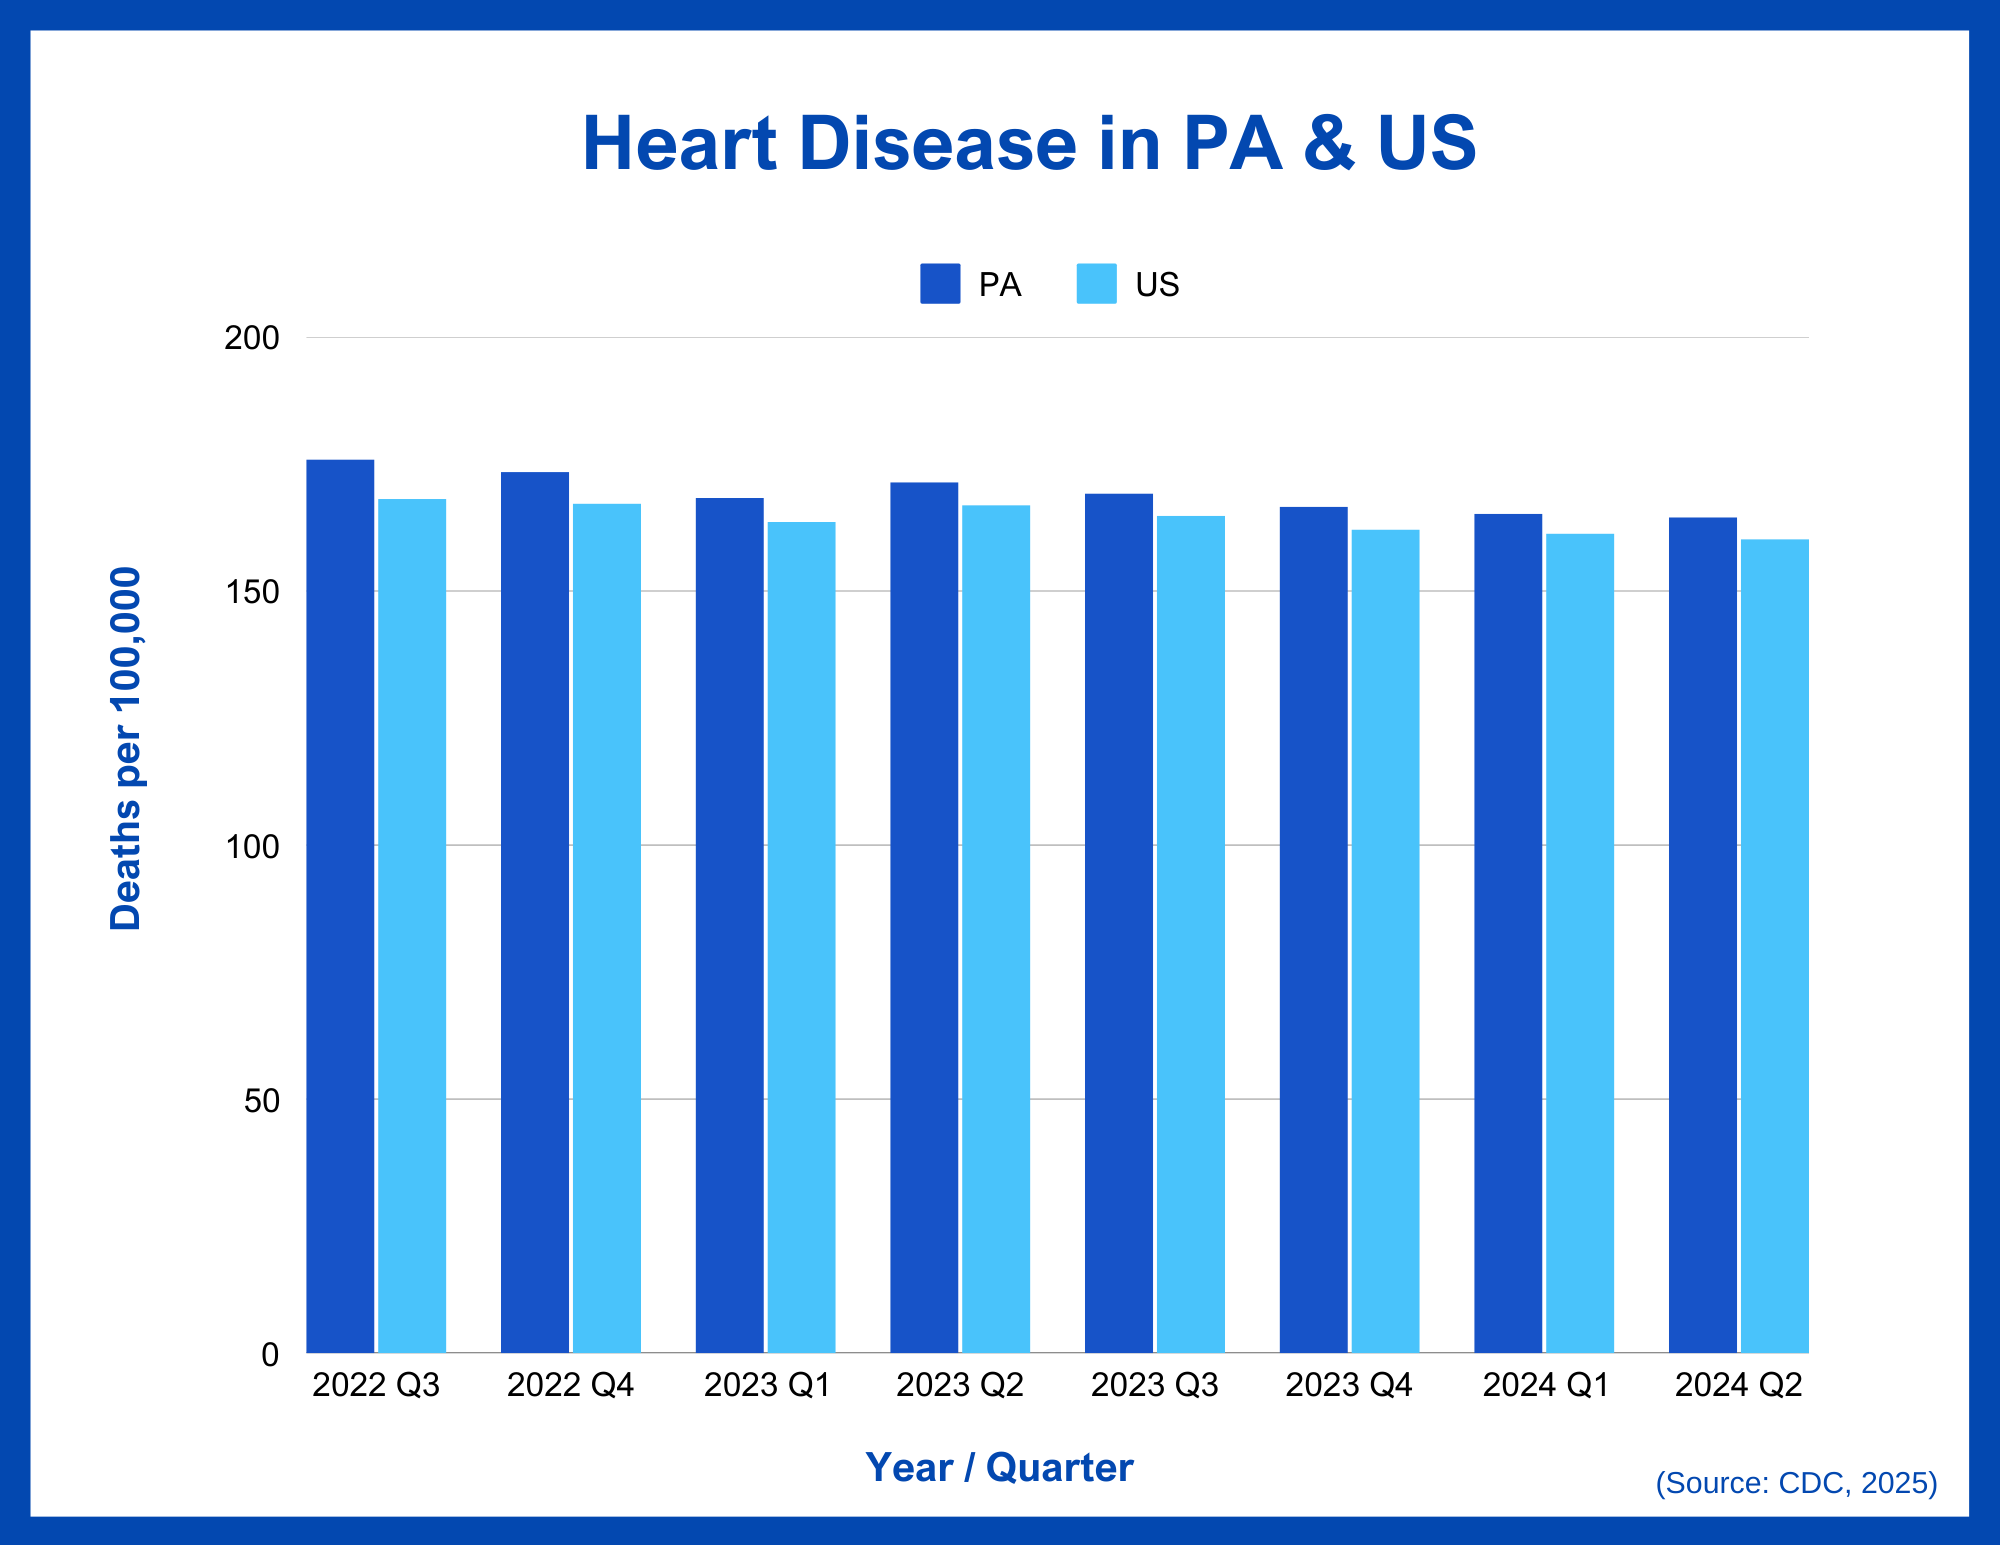
Heart Disease in PA Higher than National Average.This bar chart shows that Pennsylvanians have higher rates of heart disease than the national average. According to the US Centers for Disease Control, Heart Disease is the leading cause of death in PA and in the US, making access to healthcare and accurate and regular monitoring especially important for residents of the Commonwealth and across the United States. (Source: CDC, 2025)
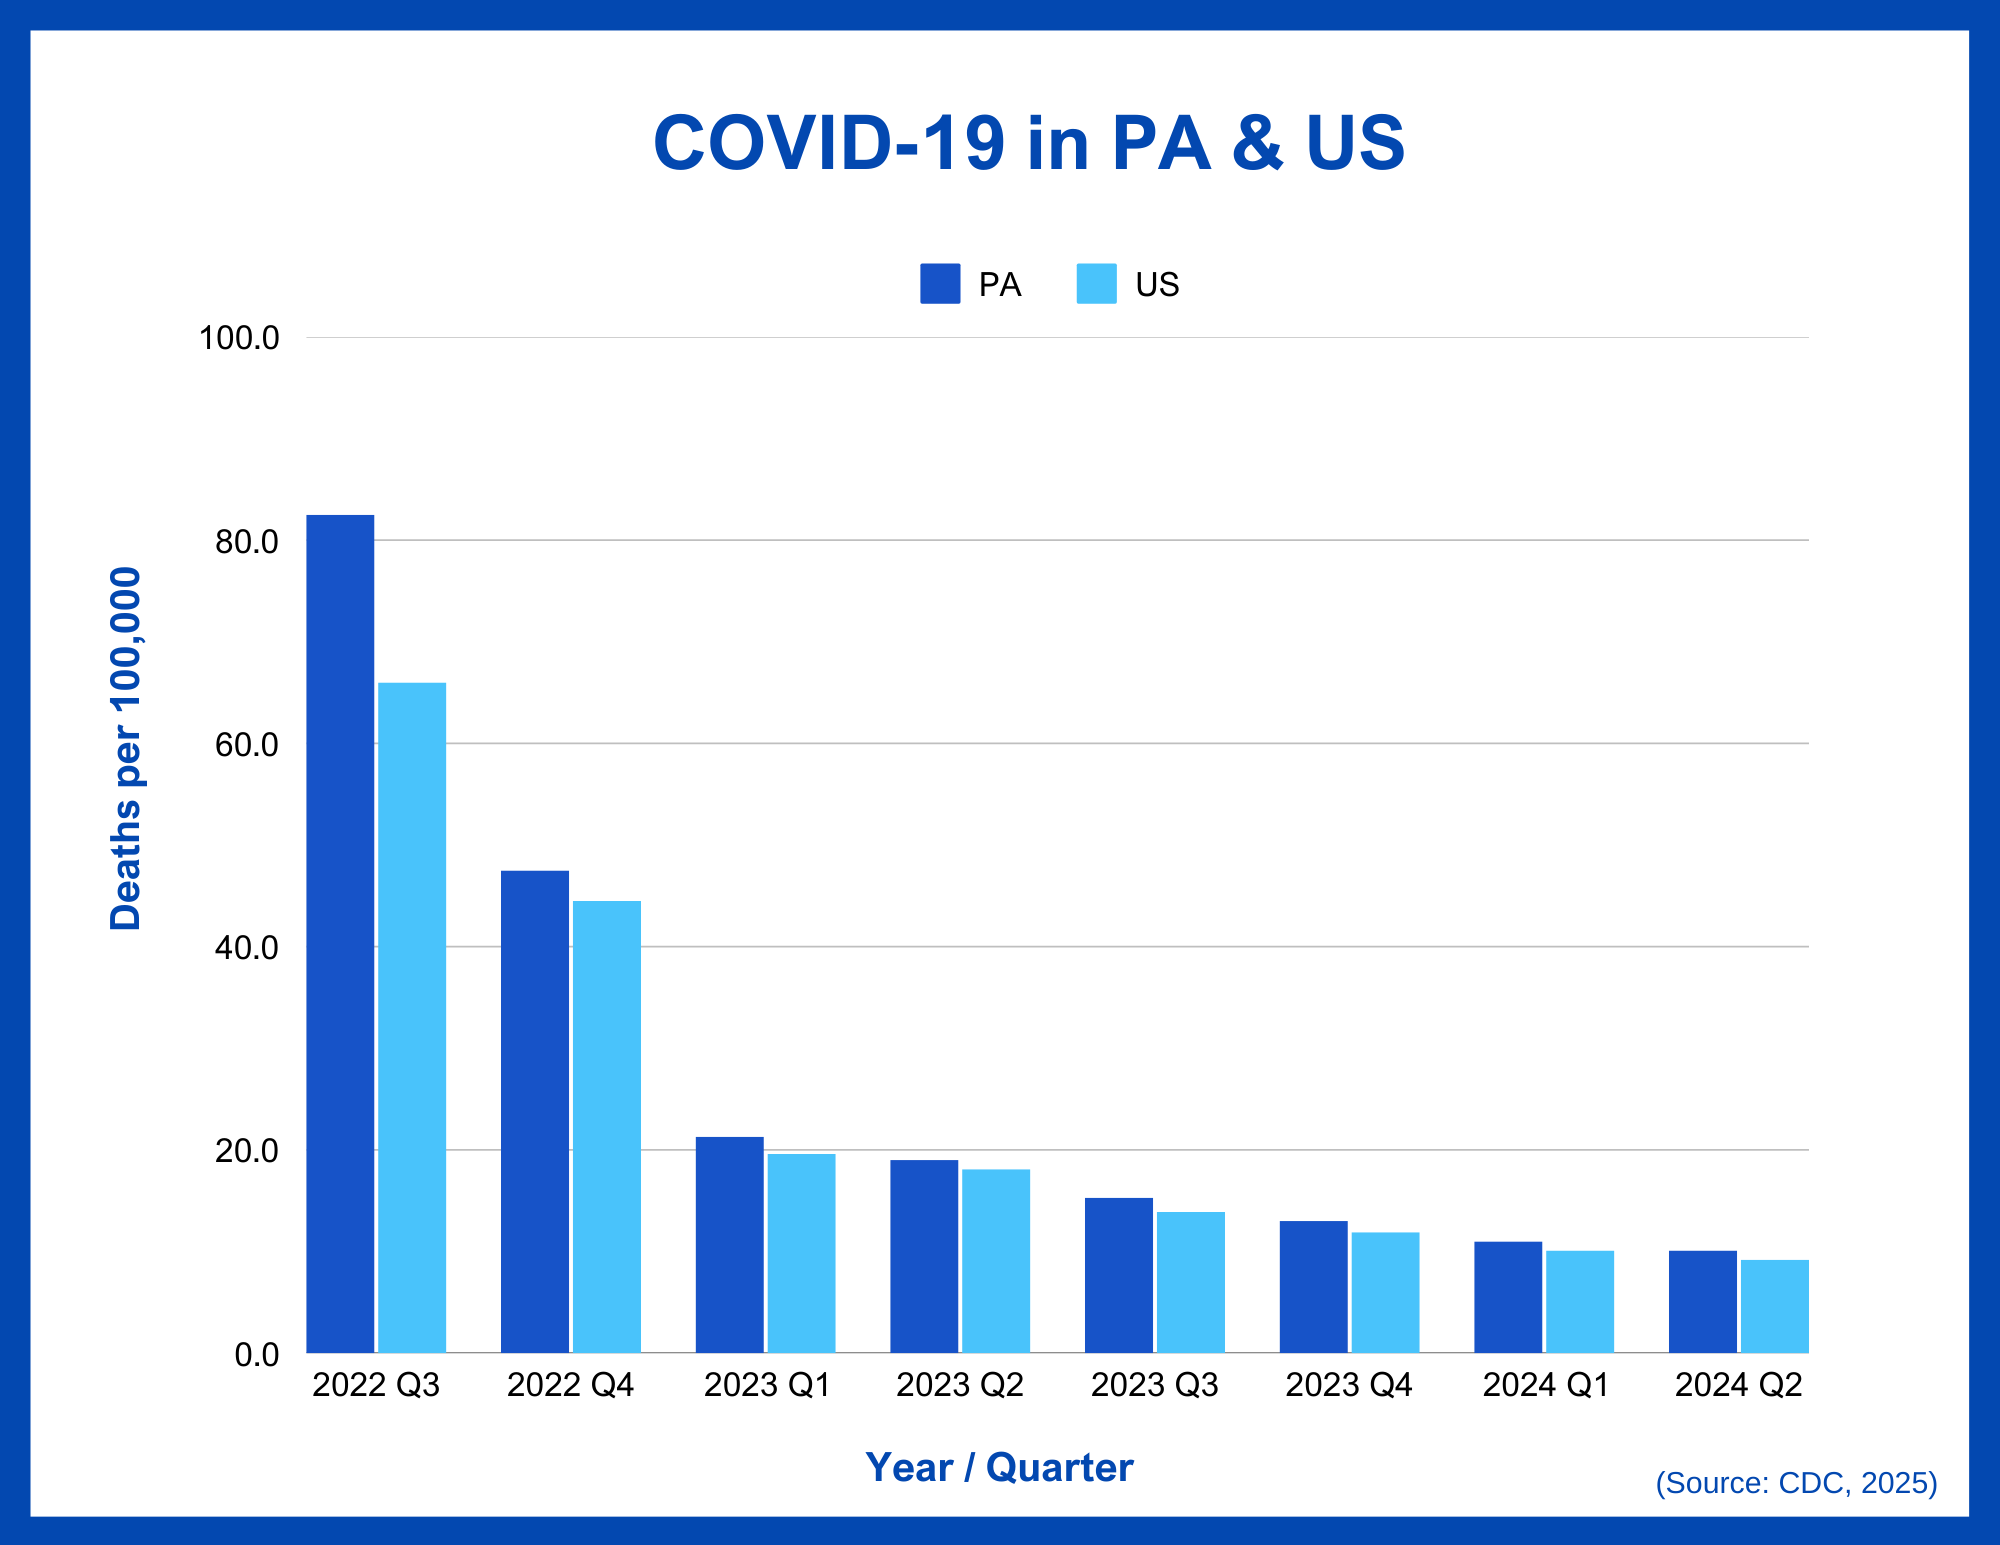
COVID-19 in PA Higher than National Average. This bar chart shows that Pennsylvanians have higher rates of COVID-19, a serious lower respiratory disease, than the national average. According to the US Centers for Disease Control, COVID-19 remains a significant cause of death in PA and in the US. Other Chronic Lower Respiratory Diseases such as COPD and Asthma are also leading causes of illness and death in the Commonwealth. (Source: CDC, 2025)
PA Case Study
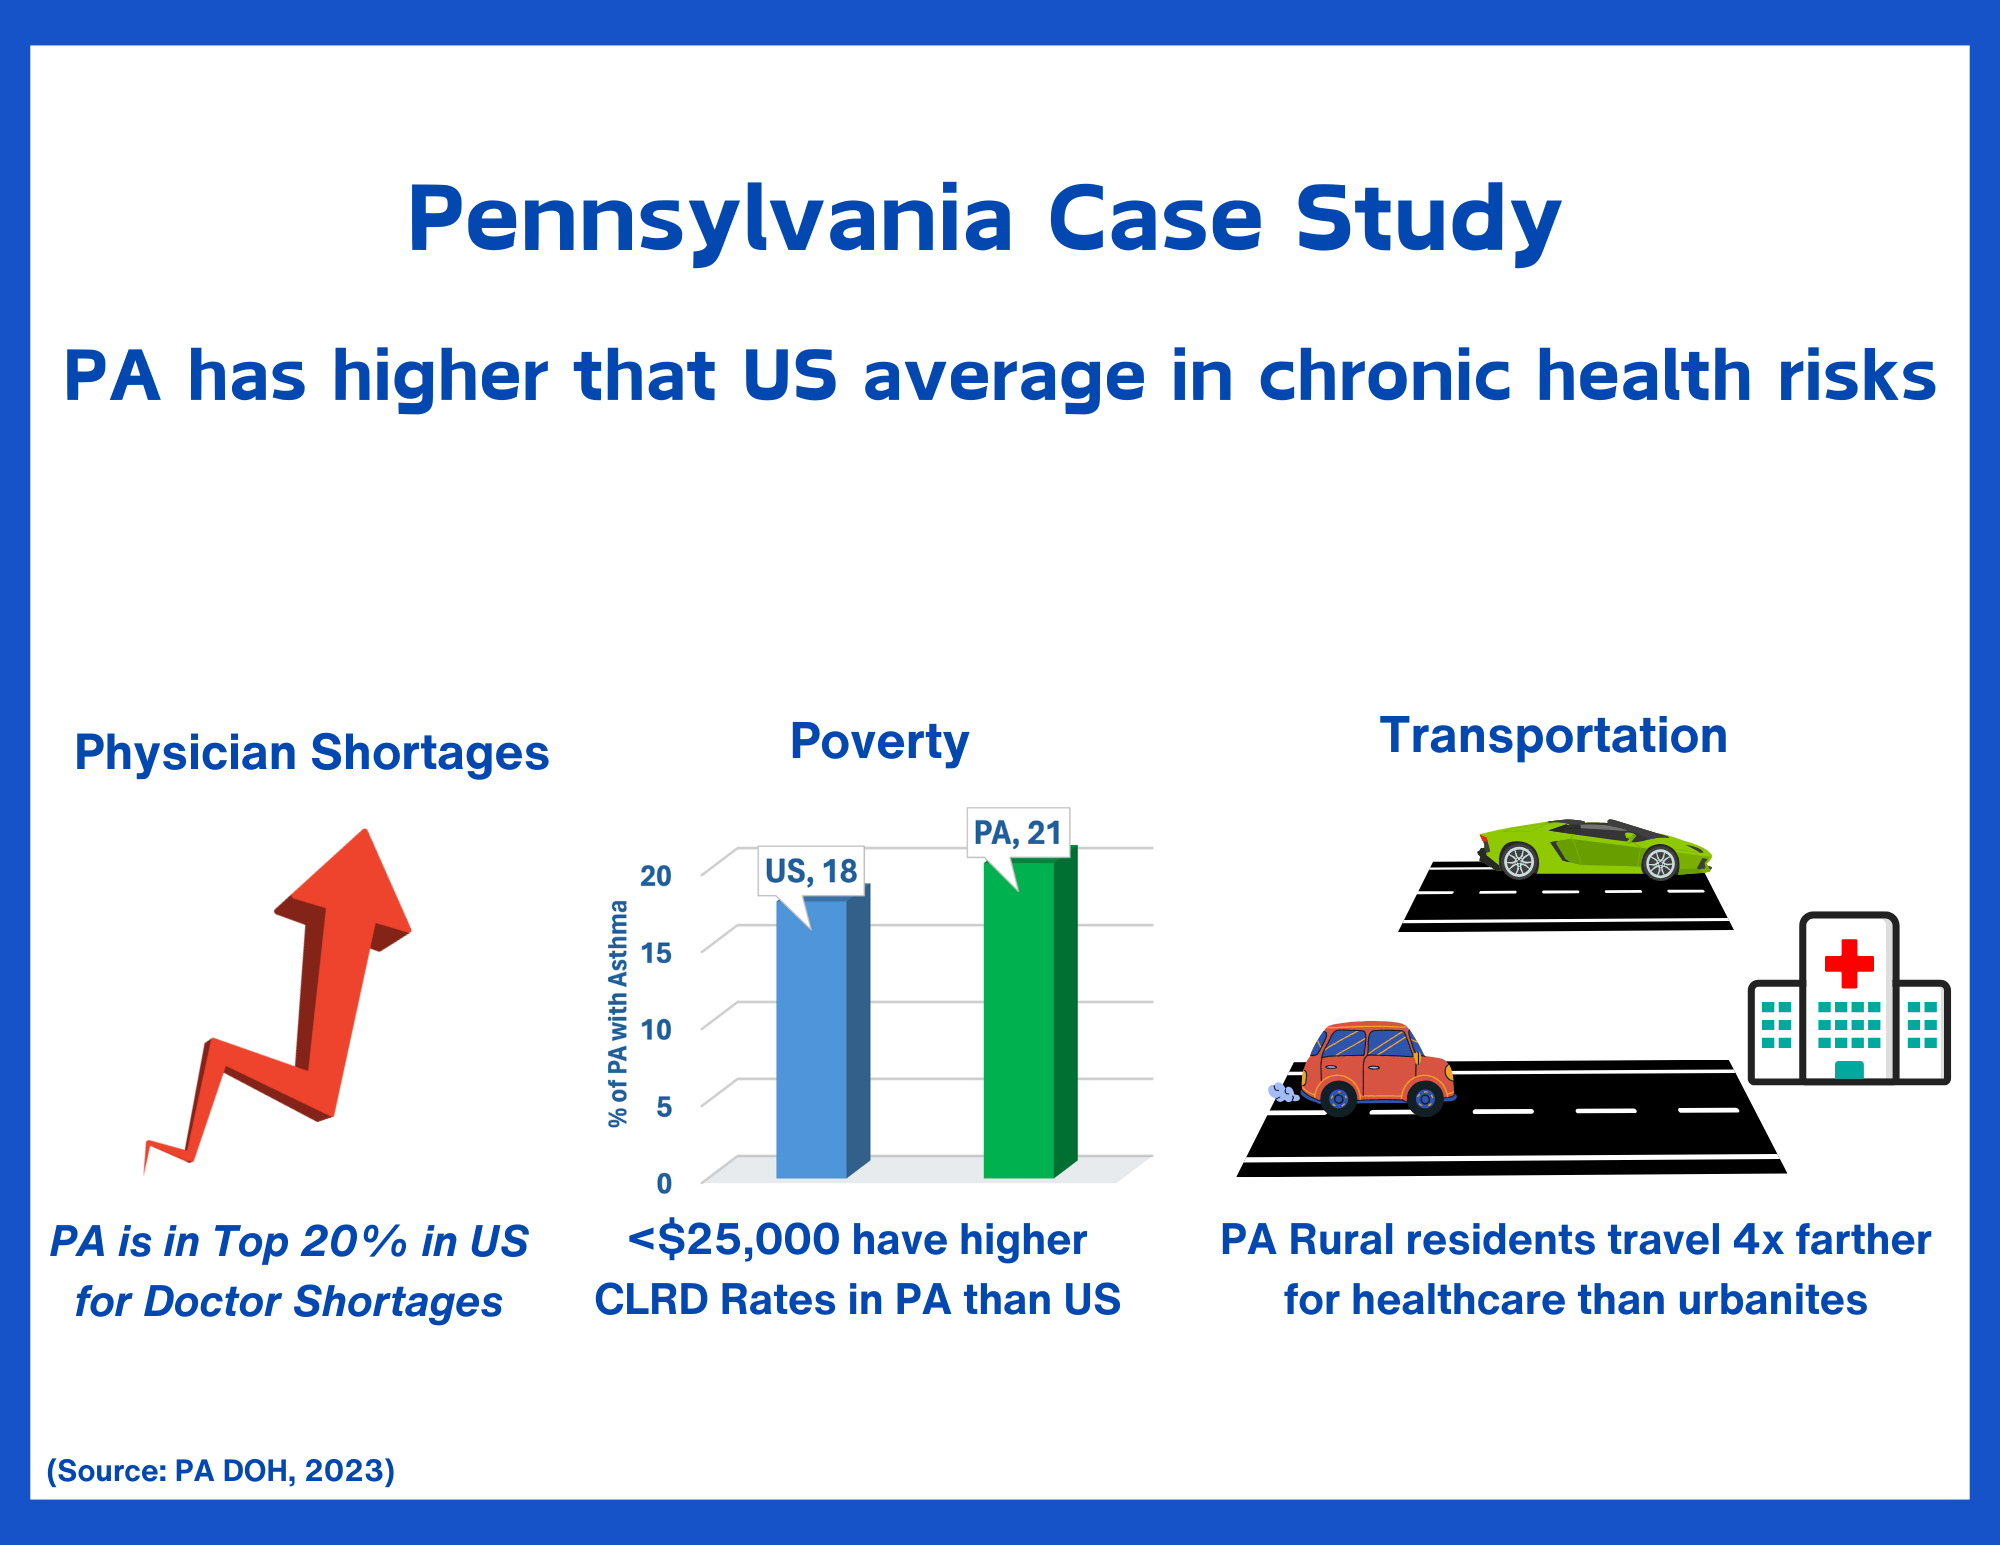
PA Case Study of Chronic Health Risks.This graphic illustrates the connections between barriers to healthcare in the Commonwealth of Pennsylvania and variables such as income, transportation, and physician shortages. (Source: CDC, 2025)
A recent report by AARP notes that 14% of Commonwealth residents live in "medically underserved" regions. It further reports that 22% live in areas designated as "medically underserved" and have a shortage of health professions. Most of these residents are rural, minorities, poorly educated, low-income, and have limited access to transportation. (Source: DiMaria-Ghalili, 2021. Image created by Emma Simmons)


Team BioTech
Phase 1 Information:
Problems & Research
This page includes additional information relevant to Phase 1 of the Project, "Problem and Research." The materials on this page include high resolution and scalable photographs, videos, charts, and graphics, along with detailed captions. All Charts, Graphs, and Images were designed by Emma A. Simmons and/or Sarah C. Simmons. Still Photographs and Videos were created by Lisa S. McLeod-Simmons (Copyright Notice, Image/Multimedia Use Release. Notice).
Click on Images to view full-size.