
.png)

Team BioTech
Phase 5 Information:
Findings & Analysis
This page includes additional information relevant to Phase 5 of the Project, "Findings and Analysis." The materials on this page include high resolution and scalable photographs, videos, charts, and graphics, along with detailed captions. All Charts, Graphs, and Images were designed by Emma A. Simmons and/or Sarah C. Simmons. Still Photographs and Videos were created by Lisa S. McLeod-Simmons (Copyright Notice, Image/Multimedia Use Release. Notice).
Click on Images to enlarge
Phase 5 Video

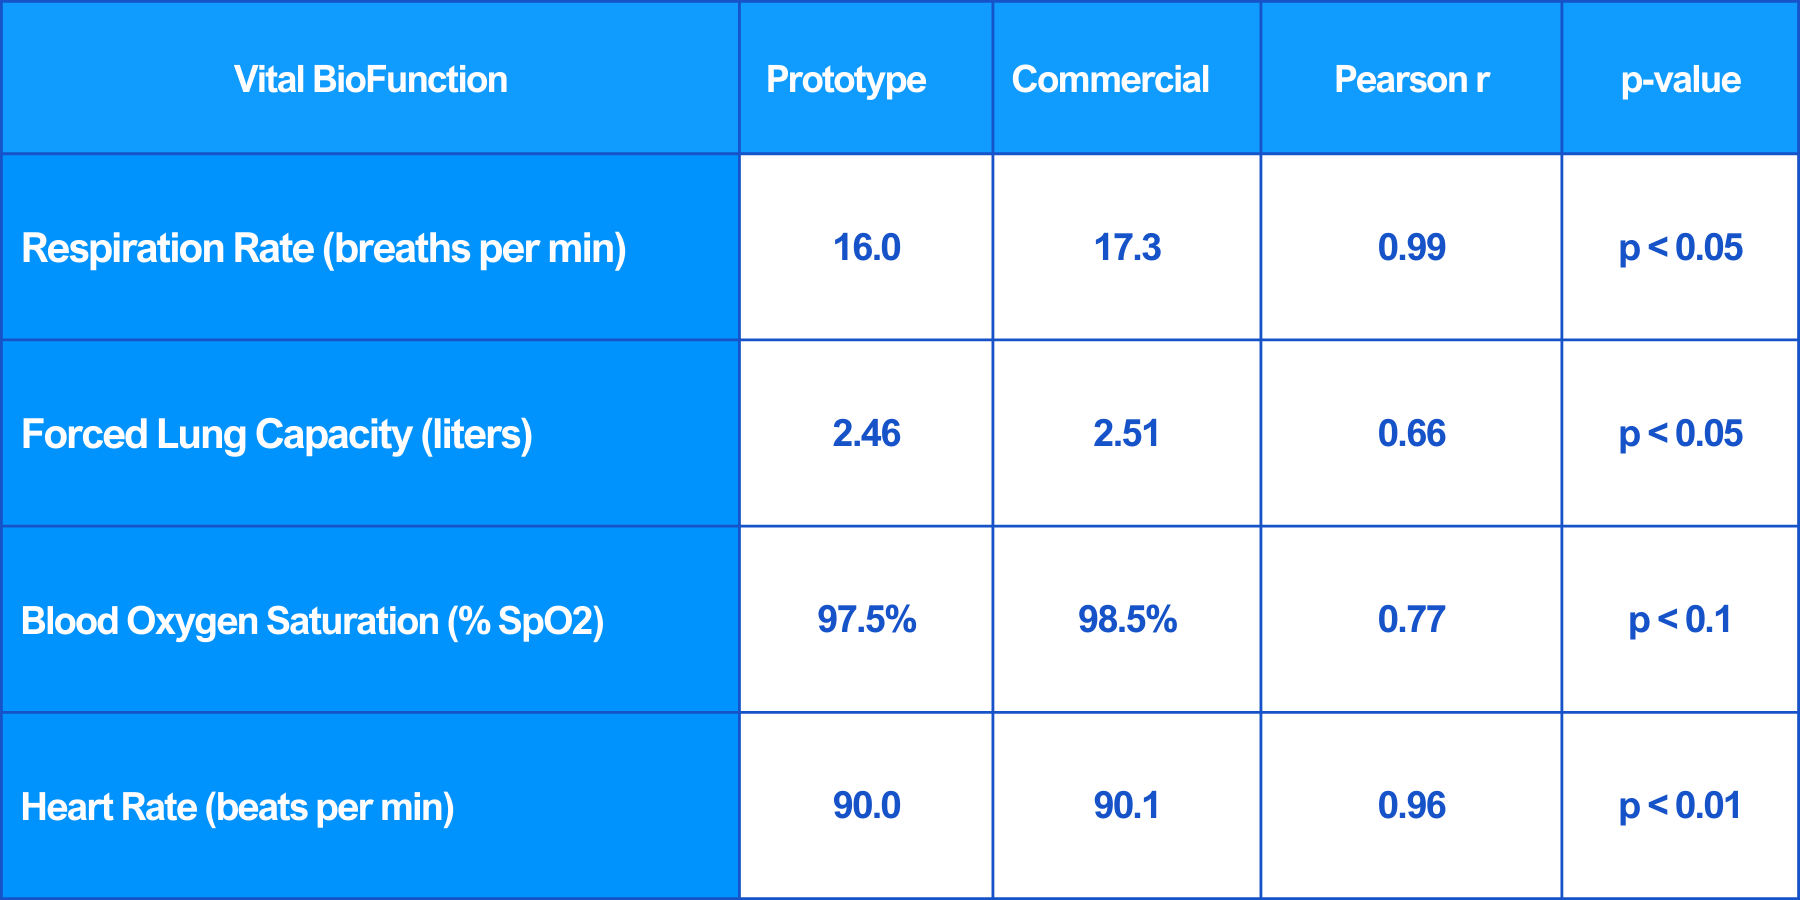
Biofunction Comparison table
The data on this Table shows that the Vital Air 2.0 Prototype produced vital biofunction measurements that were highly correlated with commercial equipment with p-values that were significant at p < 0.01 to marginally significant at p = 0.1. Commercial equipment used in testing included BioPac Spirometer for RR and FVC, and Santamedical Fingertip Pulse-SpO2 Oximeter for beats per min and %Blood SpO2.
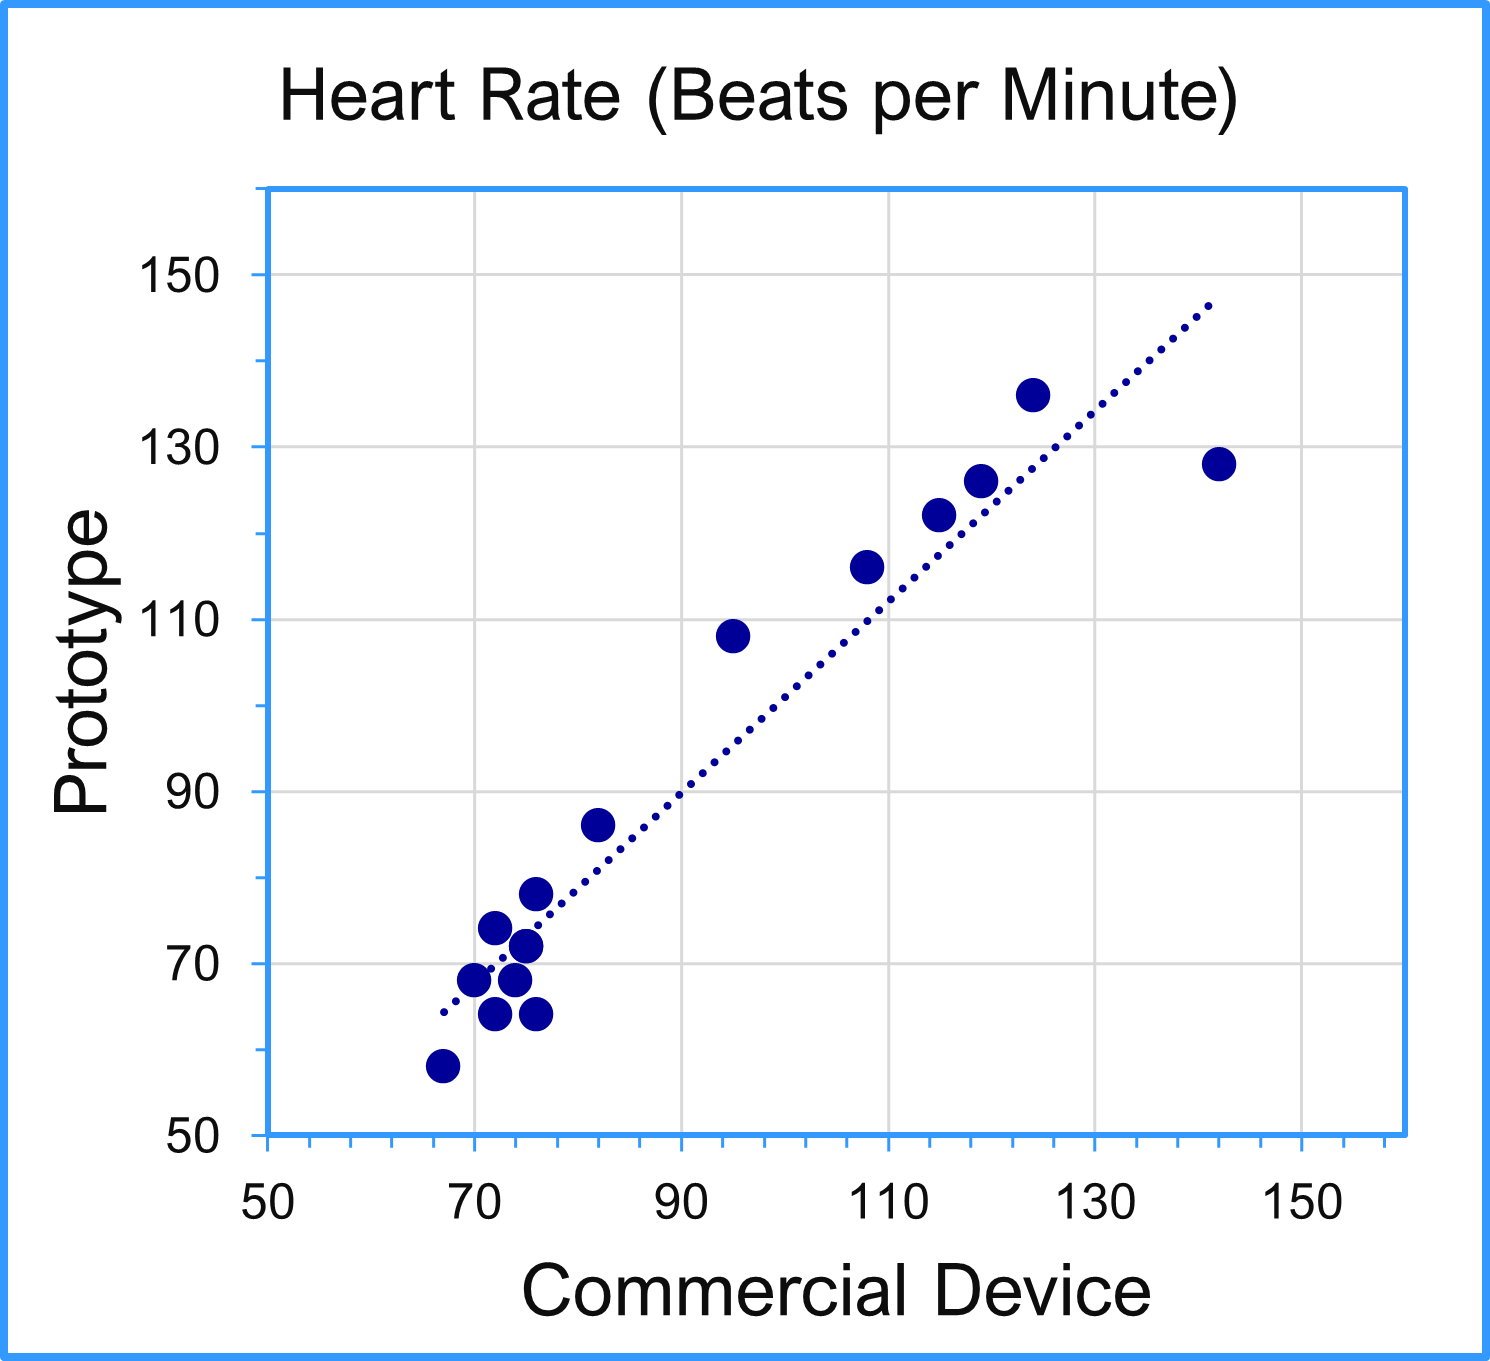
Heart Rate Correlation Chart
This chart provides a comparison of heart rate measured by the prototype and the Santamedical pulse oximeter. Pearson-r analysis shows a very strong correlation between the two devices at p<0.01. This indicates that the Prototype's heart rate measurements are as accurate as a commercial device.

Graphene Resistance Test
The electrical resistance of graphene-coated conductive fabric was compared with uncoated fabric while subjected to repeated washing and drying cycles using a commercial laundry detergent. Resistance of the graphene-coated fabric was initially lower than the uncoated fabric but increased to a higher resistance over time. This test shows that the graphene epoxy used will not likely improve performance.

Sample Prototype Respiration Output
This chart shows the analog voltage output of the conductive fabric biosensor over a period of 80 seconds. The troughs indicate inhalations and the peaks represent exhalations. The biosensor clearly shows variations in breathing patterns, indicating that the Prototype has sufficient sensitivity for detecting abnormal respiration.
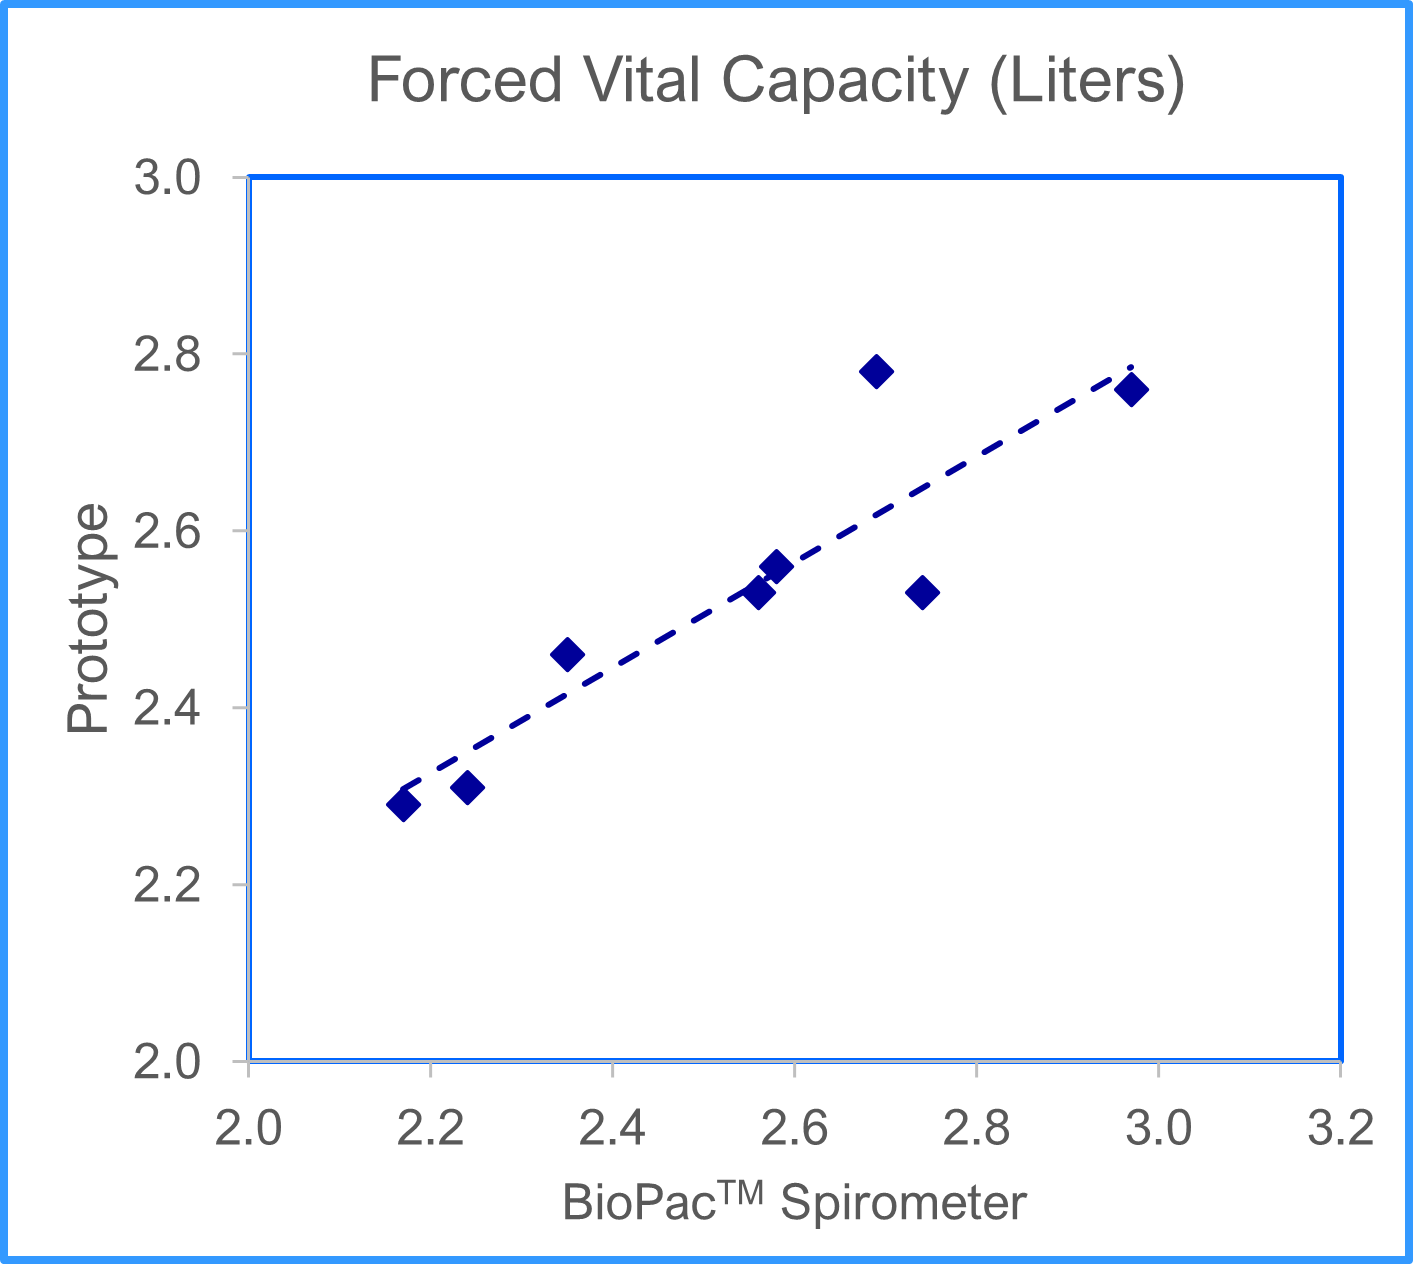
Forced Vital Capacity Chart
This comparison chart shows a strong correlation between the commercial BioPac spirometer and the Vital Air 2.0 Prototype. The Pearson-r analysis returns a p-value of <0.05, indicating that the Prototype is comparably accurate to this commercial instrument.