
.png)

Team BioTech
Phase 2 Information
This page includes additional information relevant to Phase 2 of the Project, "Goals." These Charts, Graphs, and Images include detailed captions. Captions include links to sources. All Charts, Graphs, and Images were designed by Emma A. Simmons and/or Sarah C. Simmons. Still Photographs and Videos were created by Lisa S. McLeod-Simmons (Copyright Notice, Image/Multimedia Use Release Notice).
Click on Images to Enlarge
Team BioTech
Phase 2 Information:
Project Goals
This page includes additional information relevant to Phase 2 of the Project, "Project Goals." These Charts, Graphs, and Images include detailed captions. Captions include links to sources. All Charts, Graphs, and Images were designed by Emma A. Simmons and/or Sarah C. Simmons. Still Photographs and Videos were created by Lisa S. McLeod-Simmons (Copyright Notice, Image/Multimedia Use Release Notice)
Click on Images to Enlarge

Team BioTech
Phase 2 Information:
Goals
This page includes additional information relevant to Phase 2 of the Project, "Project Goals." The materials on this page include high resolution and scalable photographs, videos, charts, and graphics, along with detailed captions. All Charts, Graphs, and Images were designed by Emma A. Simmons and/or Sarah C. Simmons. Still Photographs and Videos were created by Lisa S. McLeod-Simmons (Copyright Notice, Image/Multimedia Use Release. Notice).
Click on Images to view full-size.

Biomedical
Engineering
01
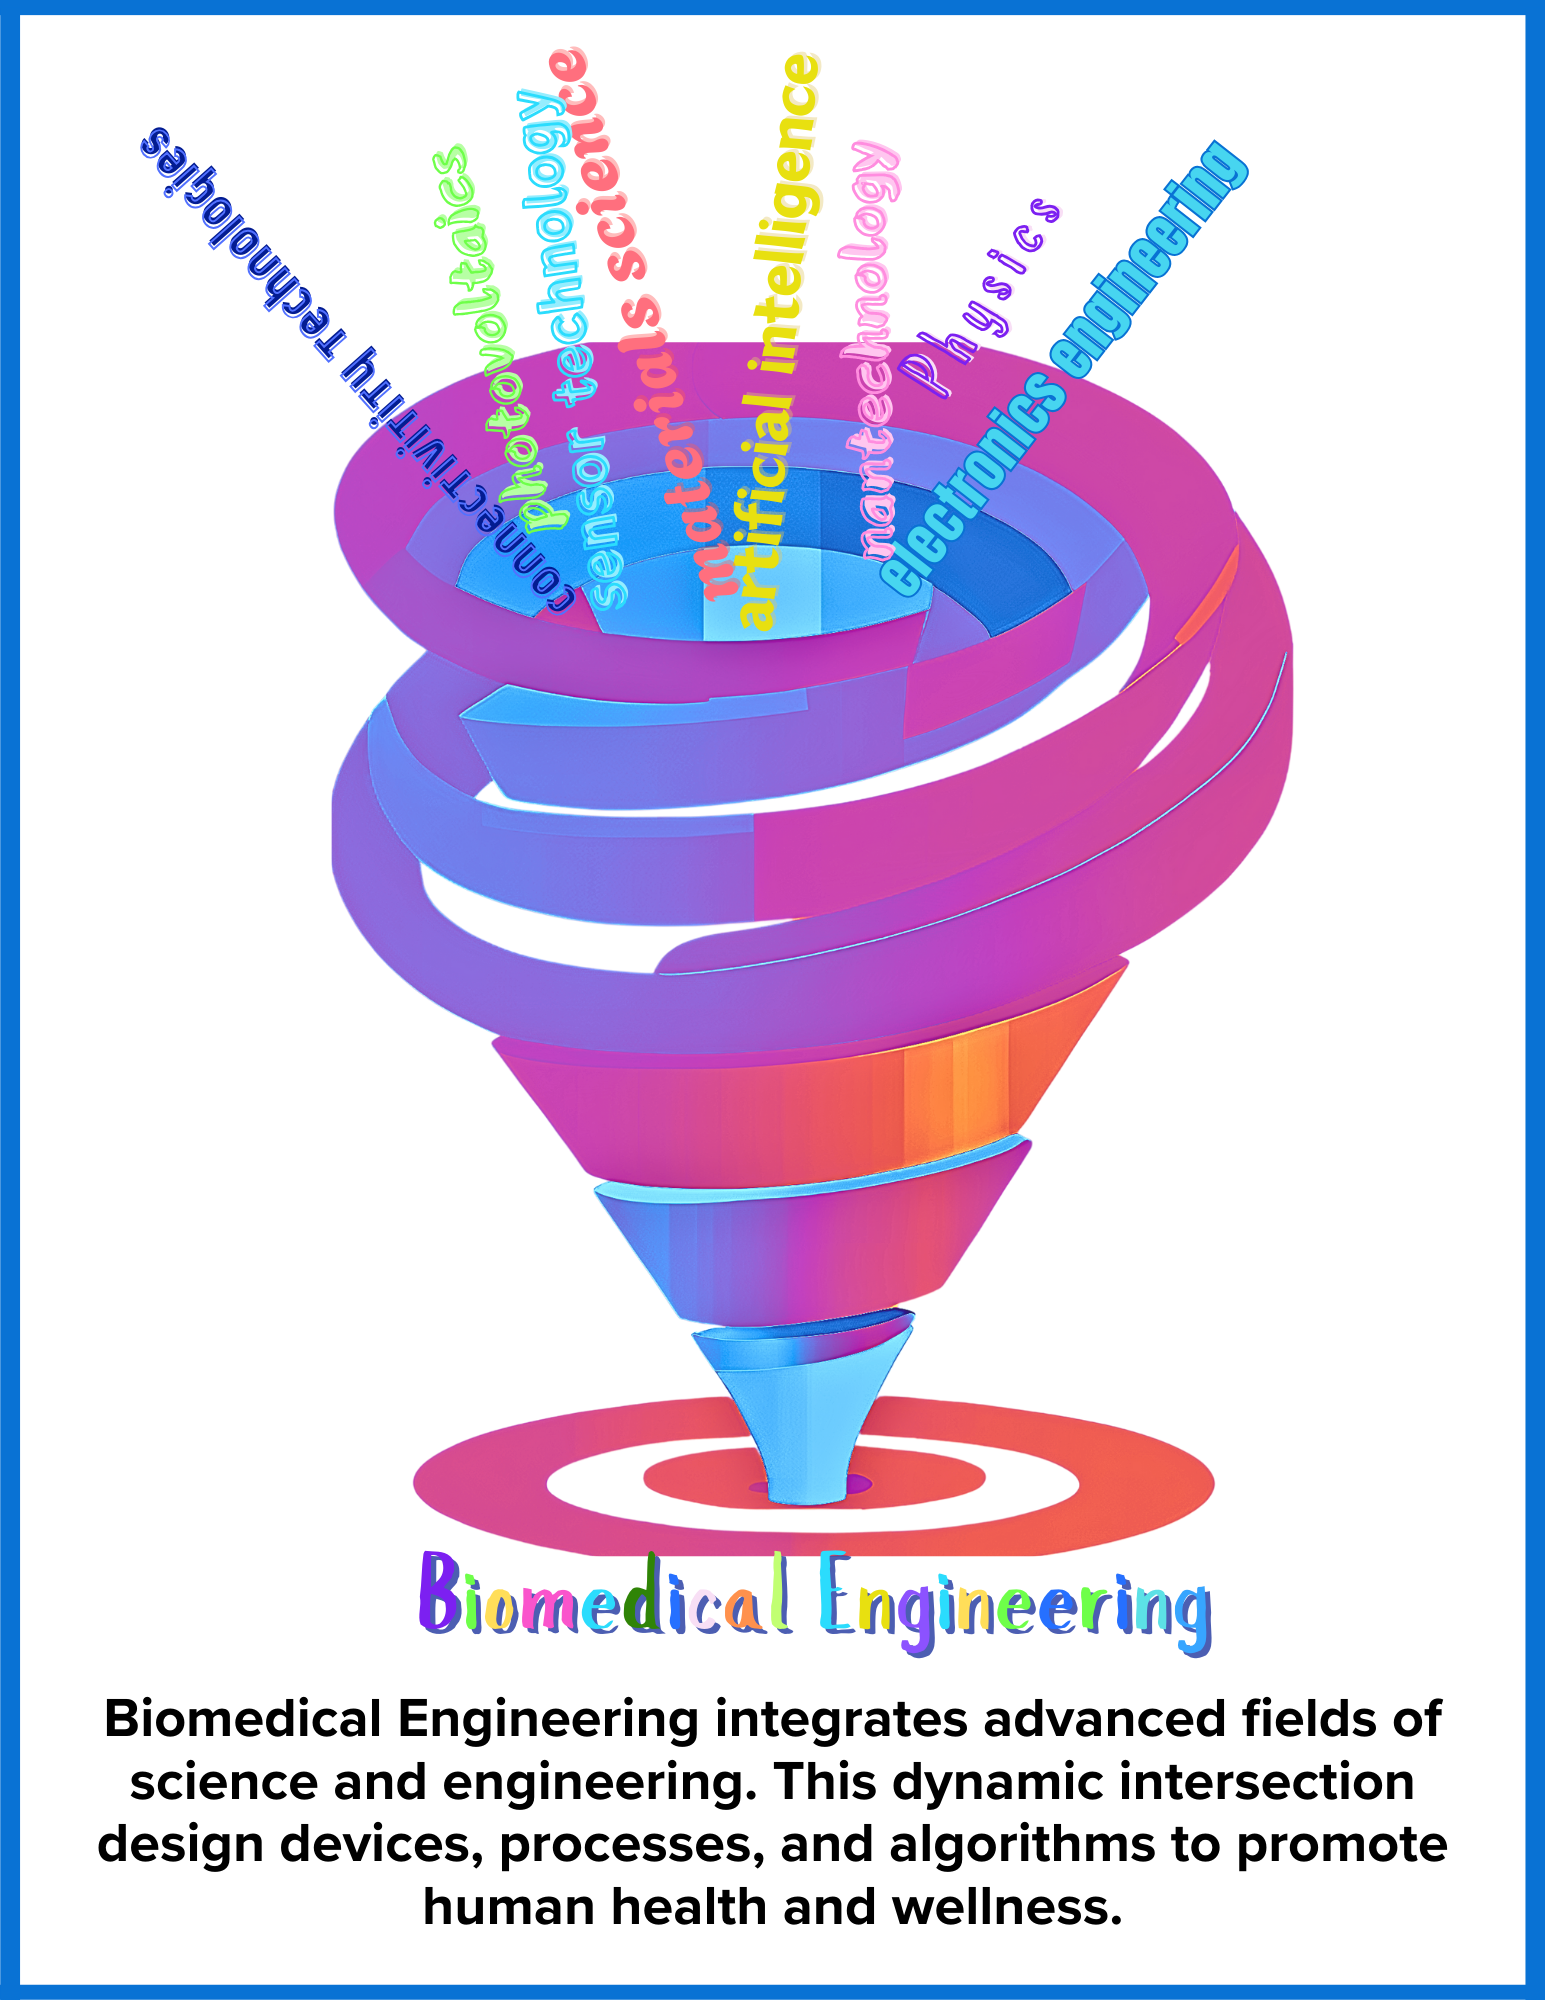
Biomedical Engineering Defined. This graphic defines Biomedical Engineering and explains how it integrates various fields of science, technology, and engineering.
Click on Image to Enlarge.
02
Our project focuses on engineering a biomedical prototype that has the potential to enhance access to healthcare for both patients and to provide a tool that can be used by healthcare professionals to better monitor the vital signs of patients.
03
We designed this graphic to illustrate how biomedical engineering incorporates and integrates various fields of science, engineering, and technology.

Workflow
Timeline
01
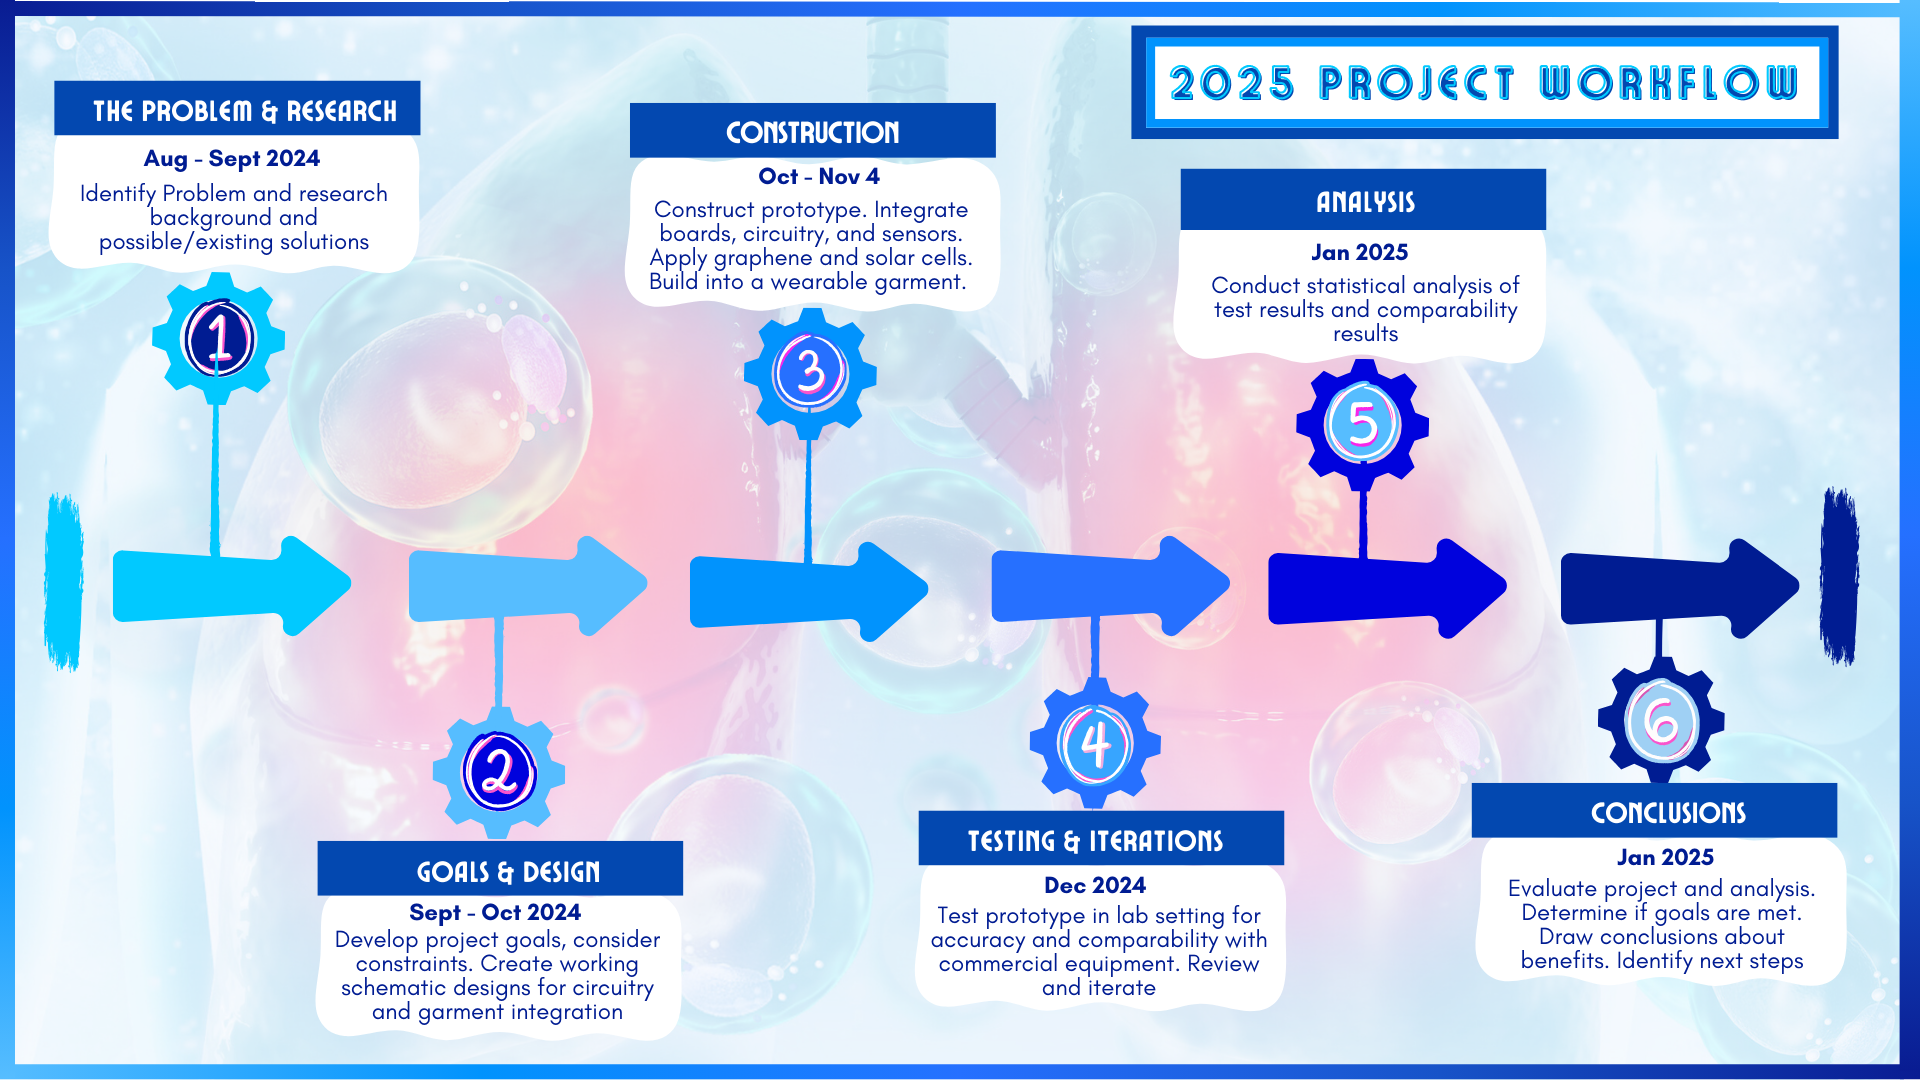
Project Workflow Timeline. This graphic shows the pacing of our project based on key engineering phases.
Click on Image to Enlarge.
02
We followed standard engineering phases throughout this project. While the graphic is linear, there were many times that we 'backtracked' to revisit, reconsider, do more research, brainstorm, test, iterate, re-test and redesign.
IRB Approval

01
We were granted approval to conduct research by the Institutional review Board (IRB) at Mount St. Mary's University, where we tested the Prototype.
02